
Regional Trends
Reading the market beyond the headlines — a closer look at the regions and neighbourhoods shaping Singapore property decisions.
Orchard, River Valley, Bukit Timah, Newton, Novena, Marina Bay and Sentosa.
Queenstown, Tiong Bahru, Toa Payoh, Bishan, Kallang, Geylang and selected East Coast areas.
Tampines, Bedok, Pasir Ris, Punggol, Sengkang, Woodlands, Yishun, Jurong and other suburban neighbourhoods.
How have property prices changed across Singapore since 2000?
Explore the historical price trends of new launch and resale condominiums across Singapore’s three main regions — CCR, RCR and OCR.
Understand how property prices have changed over the years and how different regions have performed.
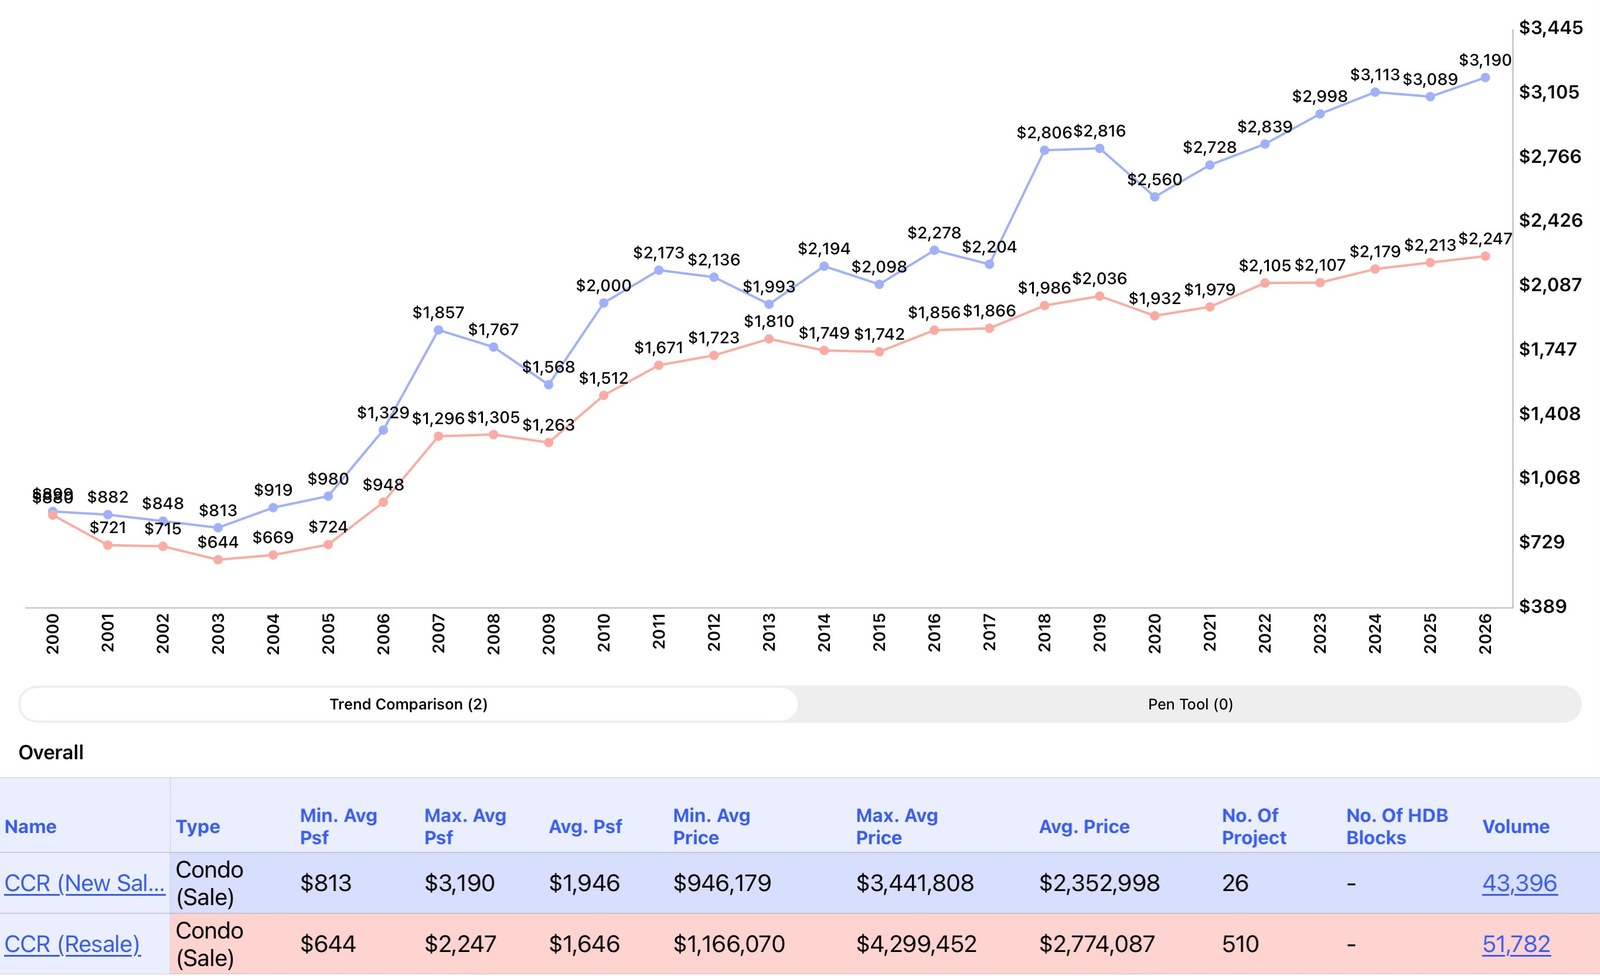
Core Central Region (CCR)
Includes Orchard, River Valley, Bukit Timah, Newton, Novena, Marina Bay and Sentosa.
Districts: 9, 10 and 11, together with selected areas in Districts 1, 2, 4, 6 and 7.
Explore the historical price trends of new launch and resale condominiums in Singapore’s prime residential areas.
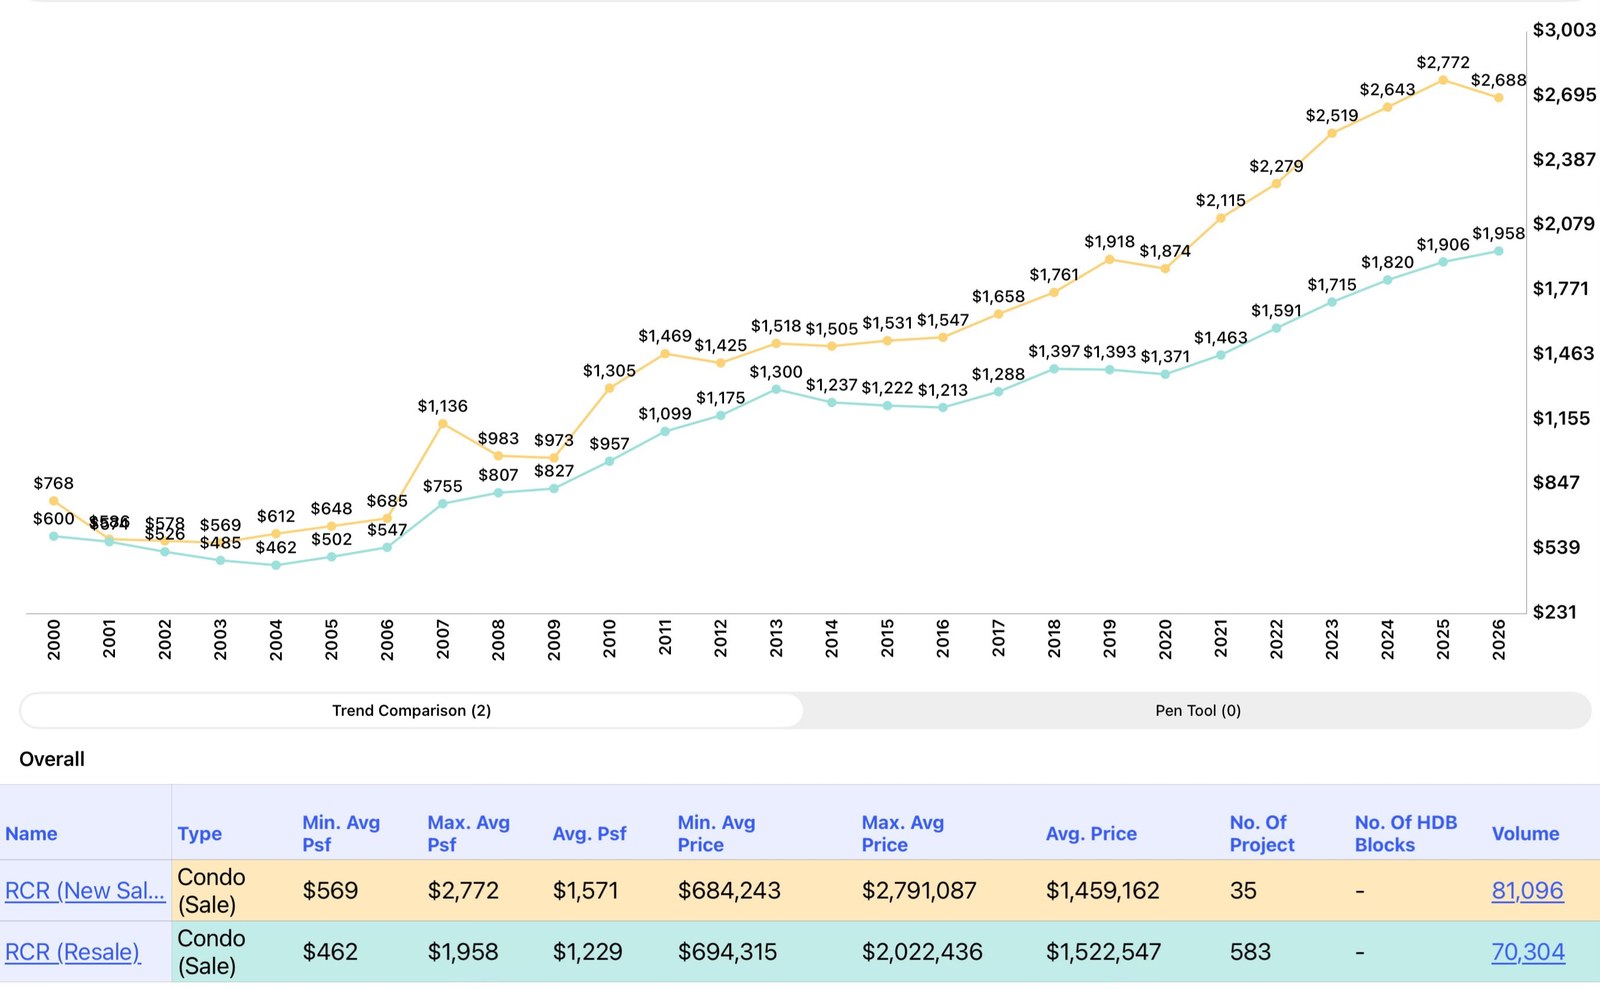
Rest of Central Region (RCR)
Includes Queenstown, Tiong Bahru, Toa Payoh, Bishan, Kallang, Geylang and selected East Coast areas.
Districts: 3, 8, 12 and 13, together with selected areas in Districts 1, 2, 4, 5, 6, 7, 14, 15 and 20.
Explore how property prices have changed across Singapore’s city-fringe neighbourhoods over the years.
Outside Central Region (OCR)
Includes Tampines, Bedok, Pasir Ris, Punggol, Sengkang, Woodlands, Yishun, Jurong and other suburban neighbourhoods.
Districts: 16–19 and 21–28, together with selected areas in Districts 5, 14, 15 and 20.
Explore the historical price trends of new launch and resale condominiums across Singapore’s suburban residential areas.
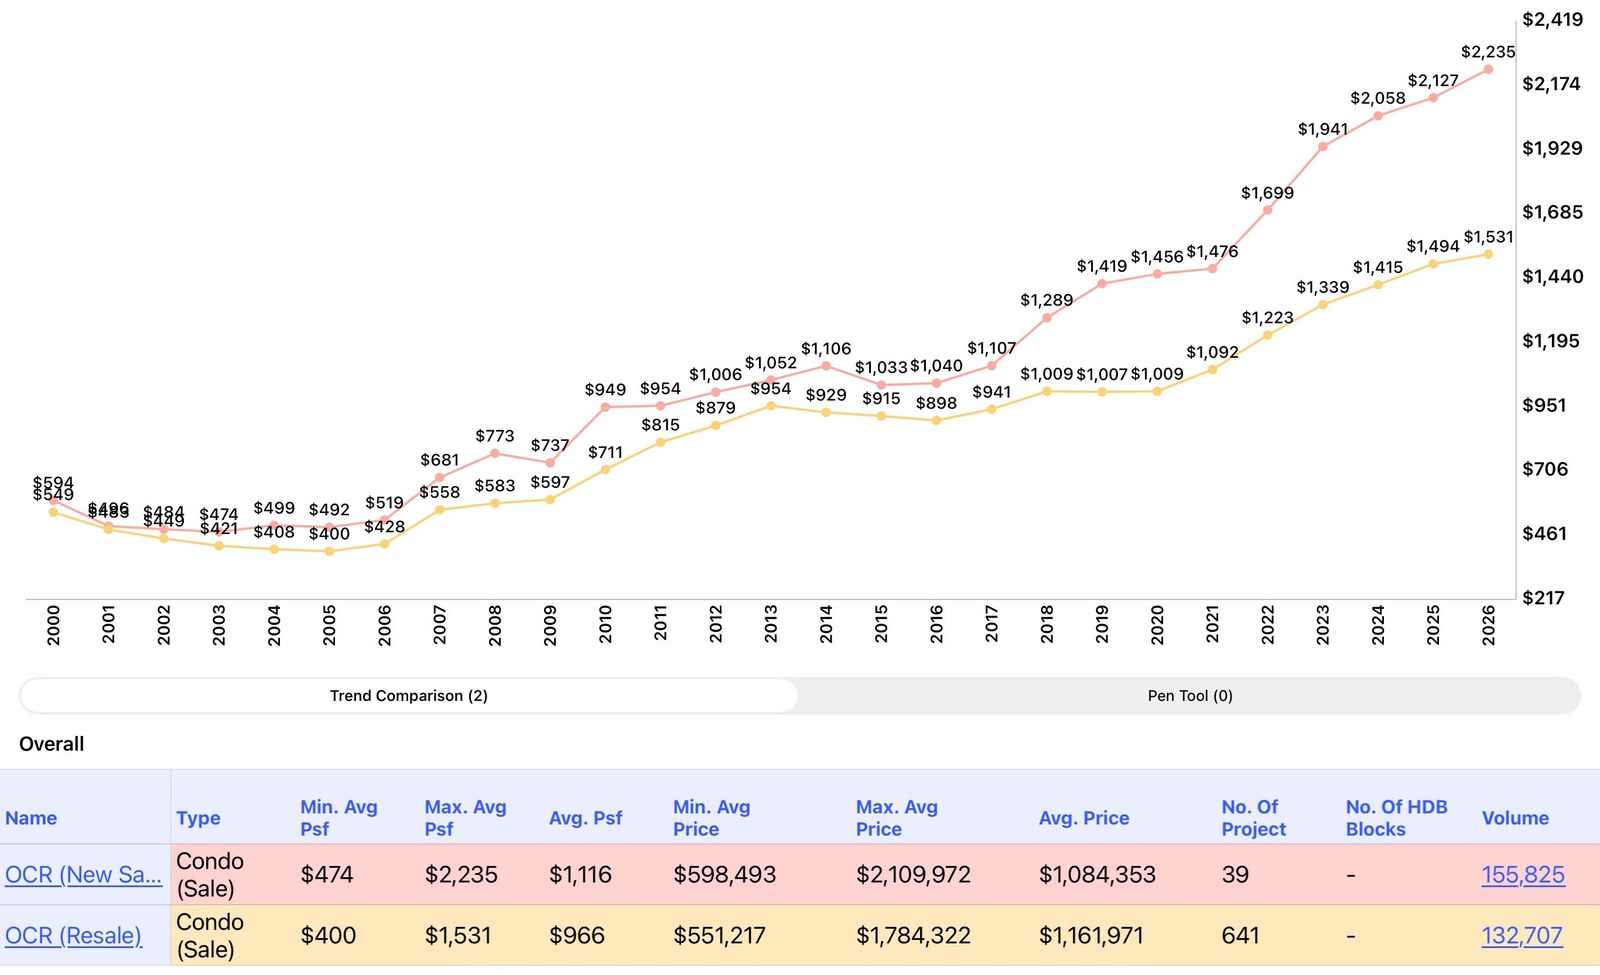
Note: Some postal districts cover more than one region. Regional classifications are based on the property’s actual location. Historical prices are for general reference and may vary depending on the properties transacted.
What Do These Trends Mean for You?
Property prices tell part of the story, but every property decision is different.
Whether you’re buying your first property, upgrading or planning your next move, it’s important to consider your finances, needs and long-term goals.
Before You Buy a Property, Build a Strategy.
Let’s look at your options together so you can make a more informed property decision.

© 2026 Perry Siow. All Rights Reserved.
CEA Reg: R006056B, a licensed real estate salesperson with PropNex Realty Pte Ltd L3008022J
Location Map: 480 Lorong 6 Toa Payoh #11-03a, Singapore 310480